


© Linetop Ltd 2021


DATA HANDLING
This page explores the whole process of how visitor data is captured and then stored with Linetop equipment, how data gets into a PC, and the possibilities then available for viewing the underlying data in different ways so as to turn a mass of raw data into useful insights, and how to share your results with other people. The banner photo shows a logger with orange memory cube, microprocessor chip and three ‘AA’ batteries to run it. Some of our loggers have a grand total display in the lid as well as or instead of the removeable memory cube inside either to make operating it very simple or to make it quick to read frequently. Processing done by the data logger It might not be obvious that a sensor installed in a position where visitor traffic is not flowing fluidly - such as at a stile or kissing gate or a car speed bump - can produce several detections for each person/car making its way past the obstacle. The very same sensor installed in a free flowing location - such as in the middle section of a trail or on an open section of road - is likely to produce only one detection per visitor or car. It follows that a sensor which works well in a ‘free flow’ situation is not going to give the right answer if it is used as-is in a ‘restricted flow’ situation. Counter equipment must therefore factor in the characteristics of the location in which it is used, and this is a unique feature of Linetop data loggers: the ability to interpret the sensor output. Linetop’s solution to the variability of counter deployment locations has been to build intelligence into our data loggers so that they interpret the stream of pulses coming from the sensor and convert them into single visitor counts which represent the individual people or cars. Our loggers are generic device which are ‘set up’ to reflect their local operating conditions. With a kissing gate, the logger is set to give each visitor (say) two seconds to pass through it, but if they are still in the gate after a couple of seconds then they are given another two seconds, and so on ad infinitum, until they really have left the gate. The result is then a single count on the logger despite there being many detections by the sensor of a slow person’s progress through that kissing gate. Clearly, a repetitive two-seconds delay scheme is not going to suit walkers using an open narrow footpath where single delays of say one second are enough to split up a crocodile of walkers into individual people and to treat a double-detection when someone lands both their feet in quick succession on a buried pressure slab as a single event, thus adding a count of just one on the logger. So the logger delay factor must be set to reflect its local environment and the local behaviour of visitors so that the data recorded is the actual footfall at that place in those circumstances rather than ‘thing detections’ that do not correspond to individuals.Flash memory cubes inside data loggers
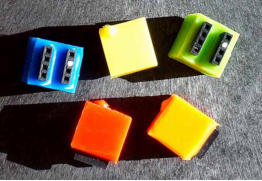
The logger stores the visitor counter in internal flash memory cube which is swapped periodically. A replacement cube is fitted and the used memory is then taken back to an office PC for downloading. You could download it to a laptop PC in the outdoors, but that is not the normal practice. The cube is polarised and cannot be fitted the wrong way around. The logger will checks there is a viable cube fitted during the process of entering the current date-time and delay settings to start it running.Downloading data into an office PC
The used flash memory cube is inserted into a Memory Cube Reader box connected to the PC via a USB cable. Our Numero app then downloads the cube. Visitor data appears on screen as a list of hourly or daily totals which can be flicked between a spreadsheet or a chart view. It is important at this stage to ‘common sense check’ the data. Are there more visitors at weekends than midweek? Is there little or nothing going on overnight? Are the numbers reasonably consistent from one day or one week to the next? Are festivals and bank holidays busier than normal days? You type in the Site Code which names the site this data came from. You enter a calibration factor if necessary - for example a factor of 0.5 is needed when cars are counted both into and out of a car park. Numero remembers such settings for future use. If it looks good then the Export button sends this data to your EcoPC database.Analysing and presenting data with EcoPC
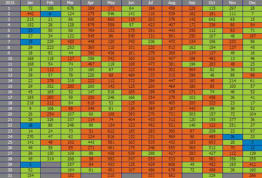
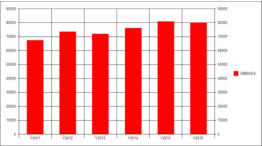
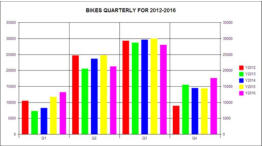
Your project will have one EcoPC database no matter how many loggers are in use. This is so that all the data from all the counters for all periods of time gets joined up and held in one place. EcoPC displays a wall-chart style of coloured calendar (in a 12x31 grid) showing the daily results for each counter for one year. The calendar cells are coloured according to how busy each day was, and you can set your own thresholds and colours. This is an extremely powerful way to visualise trends from year to year, or to compare one site with another, or to spot anything odd going on because the change in the colouring pattern stands out easily to the human eye. You can run database ‘queries’ with just a few clicks. No special database expertise is needed and everyone finds the EcoPC user interface intuitive and easy to use. The result of a query is a table of numbers like a spreadsheet along with a chart that corresponds to that table. These visual objects can then be copied and pasted into office documents like Word, Excel, Powerpoint to write reports and presentations. The underlying data inside EcoPC is hourly counts grouped on a per-site-per-year basis. But the views you can select (by running a query) will aggregate this hourly data as daily totals, weekly, monthly, quarterly or yearly totals between your choice of start and stop dates. You can include any number of sites in a query, for example to compare all your car parks within the same table or chart, or two compare car parks with a visitor centre, perhaps monthly over the course of a year or quarterly going back several years to evidence any trend in usage, as in the bottom chart.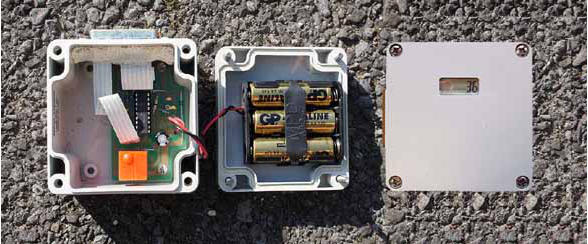


VISITOR COUNTERS


